These are three apps, programs originally written in R by Thomas Ledermann and David A. Kenny and the apps were written by David A. Kenny with help from Robert Ackerman and Thomas Ledermann. They can be directly accessed from the web without having to install R. They each take a dyadic dataset written in one structure and convert it into another structure. Two of the programs, ItoP and ItoD, provide information about the dataset and descriptive statistics. Click on one of three program's names (e.g., ItoP) below to restructure your data:
ItoP: converts an individual dataset into a pairwise dataset (learn more)
ItoD: converts an individual dataset into a dyad dataset (learn more)
DtoP: convert a dyad into a pairwise or individual dataset (learn more)
Click on the program name to run it and click on "learn more" for more information about the program. For both ItoP and ItoD, it is advisable, though not required, to have the dyad identification variable be the first variable in the input dataset. The output restructured dataset is placed where your web browser puts downloads. The program may have difficulty with datasets that have more than 750 variables. The user might be better off with a smaller dataset. The number of cases does appear to big issue but it will slow down the program.
For more information on restructuring dyadic data: Webinars on dyadic data structures and restructuring (small charge)
Read pages 14-18 in the book Dyadic Data Analysis to learn about the data types.
The Ledermann & Kenny paper on the R restructuring programs
General Details about the Programs
Overview It is strongly advised that you read this first, before looking at the specifics for each program!
Please realize that there may be some changes in the appearance of the app compared to the screenshots below, due to updates in the program. Always have a backup copy of the original dataset and always check carefully to make sure that your dataset was properly restructured.
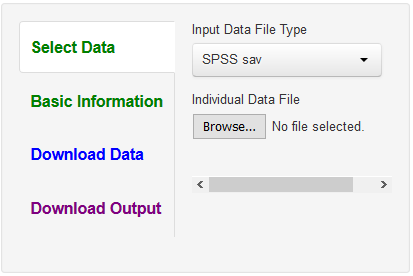
For all three programs, the user is presented with an opening screen with options (the Download Output option is not available for DtoP):
The user works through each of these options on the left. One begins with Select Data. The program defaults to an SPSS file, but a text file, csv, can be inputted by clicking on "Input Data File Type." Once the data file is selected, one hits the green "Basic Information" tab which is used to enter information as to how to restructure the data. As described below, these screens are somewhat different for each program.
For all the programs, the user can request to see the variable names in the dataset, but if the number of variables is large, this option is less than optimal as the screen is filled with variable names. For ItoP and ItoD if the datafile has less than 20 variables, the user can rename the variables for the text output (not the new dataset). Naming the variables is completely optional.
Once all the appropriate information is entered (very often defaults can be used), the blue button "Click Here to Restructure Your Data Now!" will appear at the top and the user needs to click on it:
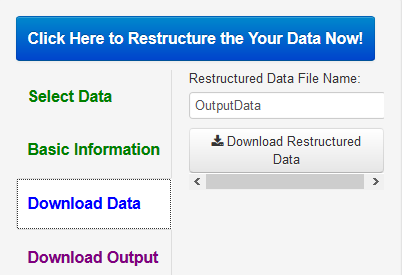
After the data have been restructured, on the right side of the screen will contain text and perhaps tables (see below) and a few cases of the restructured dataset. At this point, the user is given an option to click on "Download Data" and the following appears:
One can name the data file, the default name for ItoP being PairwiseData.csv. The datafile is placed in the location where the browser places downloaded files. The first time a file is downloaded, it may take the user a bit of time to locate it.
The restructured data file is in csv or comma separated variables format. Such a format can be read by Excel or SPSS.
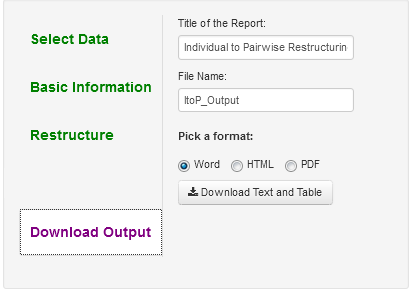
For ItoP and ItoD, the user can download the text file and table(s) that are created. The screen for ItoP is:
One enters the appropriate information and then accesses the file with the text and table(s).
Below is information about what to enter for each of the three programs.
ItoP
This program converts an individual dataset into a pairwise dataset and the R code was co-written with Thomas Ledermann. The user can read in either a csv (Excel) or sav (SPSS) file. The restructured datafile is a csv file.
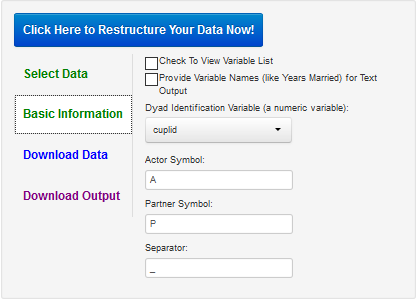
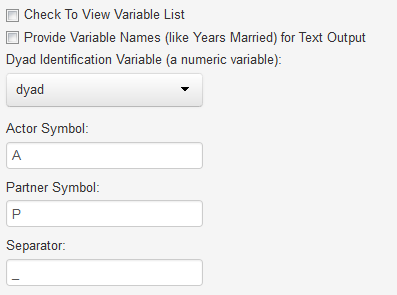
It is advisable, but not required, to have the dyad identification variable as the first variable in the original dataset. After the datafile has been read and user clicks "Basic Information," the following appears on the left side of the screen:
In most cases, the user does not need to change these defaults. One does need to sure that the correct dyad identification variable is chosen. It must be a numeric variable with no more than two cases per dyad. The program defaults with A and P for the actor and partner variables, but other choices and separators are possible.
After the "Basic Information" button is clicked, the "Click Here to Restructure Your Data Now!" blue button should appear at the top of the screen on the left. After that is clicked, the data will be restructured. For large dataset, it may take up to a minute to restructure and so be patient.
After restructuring, there should appear on the right-side of the screen text that gives a list of the within, between, and mixed variables. Also supplied are descriptive statistics: the mean, standard deviation, N, and the intraclass correlation variable for each variable. The researcher is alerted to variables that do not vary, low N variables, and variable for which only one of the two members of the dyad is measured. This program removes the string variables from the dataset, the names of which are given in the text.
Also on the right-hand side is given the first 10 cases of the restructured dataset. The restructured dataset contains a new variable called "partnum" that codes one member as a 1 and the other as a 2 and this variable can be useful is some analyses. The order of the variables in the restructured dataset is: the dyad identification variable, partnum, the between-dyads variables, the actor variables (i.e., those that have the suffix "_A"), and the partner variables (i.e., those that have the suffix "_P"). Cases are sorted by the dyad identification variable. To actually download the data, the user must hit the "Download Data" button and chose a name for the file, the default name being PairwiseData. The user needs to have hit the "Click Here to Restructure Your Data Now!" button for this option to work.
Finally, one can save the text file by clicking "Download Output." To download an example of this file click here. ItoD
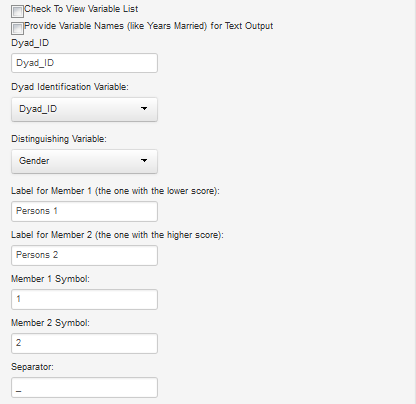
This program converts an individual dataset into a dyad dataset and the R code was co-written with Thomas Ledermann. The user can read in csv (Excel) or sav (SPSS) file. The restructured datafile is a csv file. The program presumes that the input dataset contains a distinguishing variable that is numeric (e.g., 1 and -1) and not a string (e.g., A and B). ItoD presumes that the dyad identification variable is the first variable and if not the user must select it. Similarly, if second variable is not the distinguishing variable, the user must select it. The labels are for the text output, not the dataset, that will appear on the right-hand side of the screen after the restructured dataset is created. The "Member 1 Symbol" and "Member 2 Symbol" are added as suffices in the variable name in the restructured dataset. Make sure to note which variable has the lower score as that person becomes Member 1 and the higher score becomes Member 2. So for instance, if one has men with a score of zero and women with a score of 1, one might use "M" as the Member 1 Symbol and "F" for the Member 2 Symbol. One should carefully check that it is all done correctly.
Also on the right-hand side is given the first few dyads of the restructured dataset. The order of the variables is: the dyad identification variable, the variables for Person 1, the variables for Person 2, and the between-dyads variables. To actually download the data, the user must hit the "Download Data" button, the default name being DyadData. One can also download the text output and tables.
DtoP
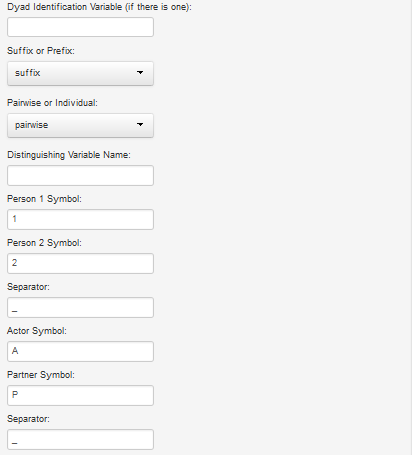
This program converts a dyad dataset into a pairwise or individual dataset and was co-written with Thomas Ledermann. The user can read in csv (Excel: comma separated variables) or sav (SPSS) file. The restructured datafile is a csv file. The program presumes that all mixed variables have a code at the end (a suffix) or beginning (a prefix) that denotes which member the variable refers to. For instance, for a dataset with heterosexual couples, the male variables might end with "_M" and the female variables with "_F." Alternatively, it might be a prefix and be "m." and "f.".If the dyad datafile is not coded in this way, the variable would have to be renamed before DtoP can be used. For the restructured dataset, a suffix is created to denote actor and partner, e. g., "A" and "P".
This program provides a very brief text output, as well as the restructured data. It does detail which variables are measured for both members, just one member, and between-dyads variables. In addition, it creates three variables: a dyad identification variable (if it was not in the original dataset), the distinguishing variable using the alphanumeric values which denoted the two members (e.g., "M" and "F"), and the distinguishing variable which is numeric, a 1 and a -1. Unlike the other two programs, string or character variables are not removed from the dataset. Although the program does not provide descriptive statistics, one can output an individual datafile, and then use the ItoD program to yield descriptive statistics.
To actually download the data, the user must hit the "Download Data" button, the default name being either PairwiseDyad_from_DyadData or IndividualDyad_from_DyadData depending the option chosen.
The RDDD R programs, with and without graphical user-interfaces, on which these programs are based

Go back to homepage.