David A. Kenny
December 9, 2013
Longitudinal Models: Autoregressive Models
Example
Dataset
Dumenci, L., & Windle, M.
(1996). A latent trait-state model of adolescent depression using the
center for epidemiologic studies-depression scale. Multivariate
Behavioral Research, 31, 313-330. Download the data.
Depression with four indicators (CESD)
PA:
Positive Affect (lack thereof)
DA:
Depressive Affect
SO:
Somatic Symptoms
IN:
Interpersonal Issues
Four times separated by 6 months
433 adolescent females
Age 16.2 at wave 1
Topics on this page
(click to go there)
Single Indicator Models (at least 3 waves)
Autoregressive
Model
One Variable
Two Variables and Cross-causal Effects
STARTS Model (at least 4 waves) – at the end of this
webpage
Multiple Indicator Models
One Construct
Saturated Model (at least 2 waves)
Correlated Errors
Invariance of Loadings
Invariance of Error Variances
Invariance of Latent Variances
Invariance
of Latent Means and Intercepts
Constraints on Latent Covariances
Autoregressive Model (2 waves)
Trait-State-Occasion Model (3 waves) – at the end of this webpage
STARTS (4 waves) – at the end of this webpage
Two Constructs: Cross-Causal Effects
Standard Model: Cross-lagged Path Model
Time Reversed Analysis
Cross-Lagged Panel Correlation (no cross-causal effects)
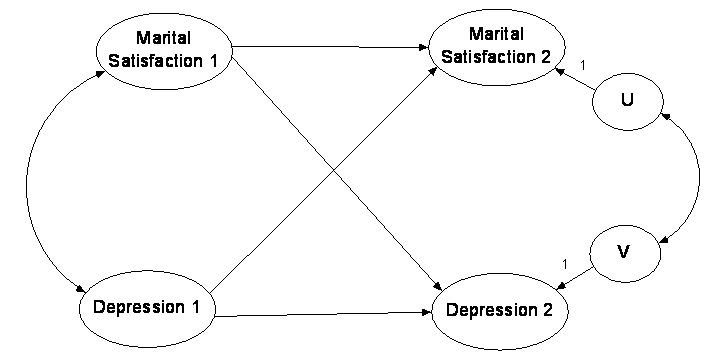
Single Indicator Variable: Autoregressive
Model
One Variable

Model
Each factor has a single indicator (path set to one)
Autoregressive factor
Errors uncorrelated
Identification
error variances and stabilities
identified for middle waves
if the equal error variance
assumption is made, model identified
must be at least three waves
with three waves, the model is saturated
over-identified
with four or more waves
model identified by
instrumental variable estimation
prior
measure used as an instrumental variable to estimate error variance
Parameters (PA example)
Stability
unstandardized (can be larger than
one)
b21 = .84, b32 = .91, b43 = .87
standardized (should not be larger
than one)
b21 = .88, b32 = .96, b43 = .88
Reliability (squared multiple correlation of the measure)
Time
1: .641
Time 2: .618
Time 3: .596
Time 4: .593
Note that there is a slight decline
over time.
Specification Error – χ²(2) = 2.175 (good fit)
Alternative models
model not autoregressive (free b31 and b42 or b41)
error variances not equal (V(E1)
= V(E2) ≠ V(E3) = V(E4): 3.82 and
3.85)
Typical Results
generally low reliability and high
stability because unstable true variance is treated as “error”
unpublished example from 1977: 4
waves of uric acid
reliabilities of about .5
stability of .888
meaning of “error” in this context
error as random change
that
change may not be measurement error in the conventional sense of the term
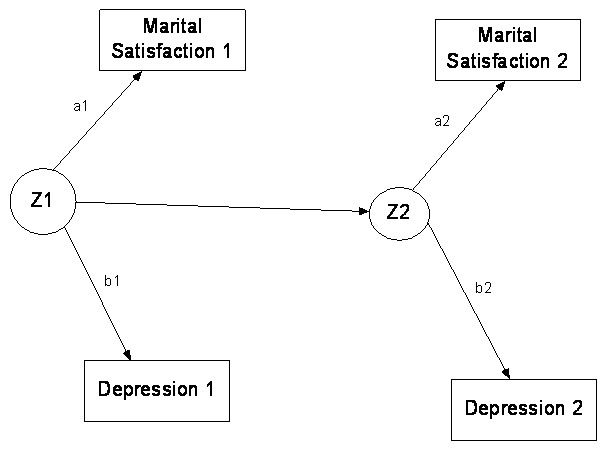
Two Variables
Structure
Set up single indicator model for both variables.
Cross-variable covariances
Time 1 latent variables
Other times correlated disturbances
Contemporaneous error covariances to be nonzero and equal at all
t waves.
Minimum number of waves to be identified: 3
Submodels
Test to determine if cross-causal paths are all zero

Selected Models
Model |
χ² |
df |
RMSEA |
χ²diff |
df diff |
p |
Comparison Model |
|
I |
Base Model |
10.059 |
9 |
0.016 |
||||
II |
No Correlated Errors |
56.662 |
10 |
0.104 |
46.603 |
1 |
<.001 |
I |
III |
No SO to DA Paths |
19.345 |
12 |
0.038 |
9.286 |
3 |
.026 |
I |
IV |
No DA to SO Paths |
10.291 |
12 |
0.000 |
0.232 |
3 |
.972 |
I |
Indication of a path from SO to DA which is negative.
Multiple Indicator Model (Single Construct)
It is necessary to test invariance in loadings over time
Required for
To claim that the latent variable is the “same” variable at each time:
Test for
Equal factor variance
Equal factor means
Almost always in the models there are correlated errors: errors of the same measure at different times correlated. Need to allow for such correlations.
Saturated Model: Correlated Errors, Equal Loadings and Error Variances
Model |
χ² |
df |
RMSEA |
χ² diff |
df diff |
p |
Comparison Model |
|
I |
No Correlated Errors |
856.729 |
98 |
0.135 |
||||
II |
Correlated Errors (CE) |
107.718 |
74 |
0.032 |
749.010 |
24 |
>.001 |
I |
III |
CE and Equal Loadings (EL) |
123.657 |
83 |
0.034 |
15.938 |
9 |
.068 |
II |
IV |
CE, EL, and Equal Error Variances |
143.645 |
95 |
0.034 |
19.998 |
12 |
.067 |
III |
Conclusions:
Correlated errors are definitely needed.
Equal loadings and equal error variances are plausible.
Saturated Model: Equal Means and Variances
Equal Variances
Allow all factors correlated (CFA: no paths between variables)
Force loadings to be equal over time (assuming it is reasonable to do so).
Force factor variances to be equal.
Optional to force equal error variances (will not be done)
Example
Chi square difference 9.762, 3 df, p = .021
Variances change over time (decline)
25.34, 25.82, 21.72, 20.09
Equal Factor Means or Intercepts
Saturated model
Free intercepts for each indicator except the marker (set it to zero)
Free the factor means (or intercept)
Intercept Invariance
Set intercepts of the indicator to the same value over time.
except the marker (set it to zero)
Free factor means (or intercepts)
6.03, 5.68, 5.13, 4.79
Decline in mean depression over time
Equal Factor Means
Set the intercepts to the same value over time.
except the markers (set them to zero)
Set factor means equal.
Tests of Equal Means and Variances
Model |
χ² |
df |
RMSEA |
χ² diff |
df diff |
p |
Comparison Model |
|
I |
Base Model |
123.657 |
83 |
.034 |
||||
II |
Equal Variances |
133.419 |
86 |
.036 |
9.762 |
3 |
.021 |
I |
III |
Equal Intercepts, Unequal Latent Means |
157.490 |
92 |
.041 |
33.833 |
9 |
<.001 |
I |
IV |
Equal Intercepts and Latent Means |
182.935 |
95 |
.046 |
25.445 |
3 |
<.001 |
III |
Conclusion: Means and intercepts very different; variances somewhat different.
Autoregressive Model
Need only two waves and set loadings equal (must be plausible)
Correlated errors
need at least 3 indicators per latent variable to be identified
with two indicators set loadings equal (both to one)
Over-Time Paths
Autoregressive
first-order
more complicated
Example (more detail below)

Poor fit
Evidence for a second-order process
Estimate |
S.E. |
C.R. |
p |
|||
S1 |
---> |
S2 |
.621 |
.044 |
14.125 |
*** |
S2 |
---> |
S3 |
.397 |
.050 |
7.920 |
*** |
S3 |
---> |
S4 |
.309 |
.061 |
5.091 |
*** |
S1 |
---> |
S3 |
.287 |
.051 |
5.634 |
*** |
S2 |
<--- |
S4 |
.304 |
.057 |
5.321 |
*** |
S1 |
<--- |
S4 |
-.013 |
.056 |
-.225 |
.822 |
Model |
χ² |
df |
RMSEA |
χ² diff |
df diff |
p |
Comparison Model |
|
I |
Saturated Model with Equal Loadings |
123.657 |
83 |
.034 |
||||
II |
Autoregressive |
183.736 |
86 |
.051 |
60.079 |
3 |
>.001 |
I |
Multiple Indicator Model with Multiple Constructs
Same measures at each time
Specification
Paths: Autoregressive: Time t constructs cause time t + 1 constructs
Correlated errors: Same measure at different times
Equality
Loadings: same measure, different times
Error variances: same measure, different times
Paths
types
stability (e.g., X1 à X2 = X2 à X3)
causal (e.g., X1 à Y2 = X2 à Y3)
trimming: for 3 or more wave models, avoid dropping paths from one wave and not the other, e.g. trimming X1 to Y2 and keeping X2 to Y3
Time-Reversed Analysis
From Campbell and Kenny, Primer on Regression Artifacts, Chapter 10
Flip times 1 and 2.
Take the paths in an over-time model and reverse their direction. This is a nonsensical analysis, but a nonsensical analysis should give nonsense results.
If the results look essential the same as a regular analysis, then the regular analysis might be wrong. Ideally, the cross-causal effects would not be negative and significant as they were in a regular analysis.

Cross-Lagged Panel Correlation (CLPC)
A simple idea: the relative size of
cross-lagged correlations reveals something about causal preponderance
Rationale
Instead of assuming causal
relationships between variables, assume that covariation is due to unspecified
set of third variables.
Assume stationarity: a1 =
a2 and b1 = b2
Standard causal model does not
really contain a reasonable null model.
It presumes that covariance between measures is created by a third variable
that has a zero autocorrelation.
Kenny and Campbell show that CLPC
can be viewed as a multiplicative MTMM:
Stationarity: Equal correlations at
each time after adjustment for changes in reliability
Temporal Erosion: Time lagged
correlations less than synchronous correlations (the method correlations
between times)
Synchronous Correlations between
Measures (the trait correlations)
Causal Clues: Deviations between
Observed and Predicted Covariances
Few researchers today use CLPC
because they want to estimate and test a causal not a non-causal
model.
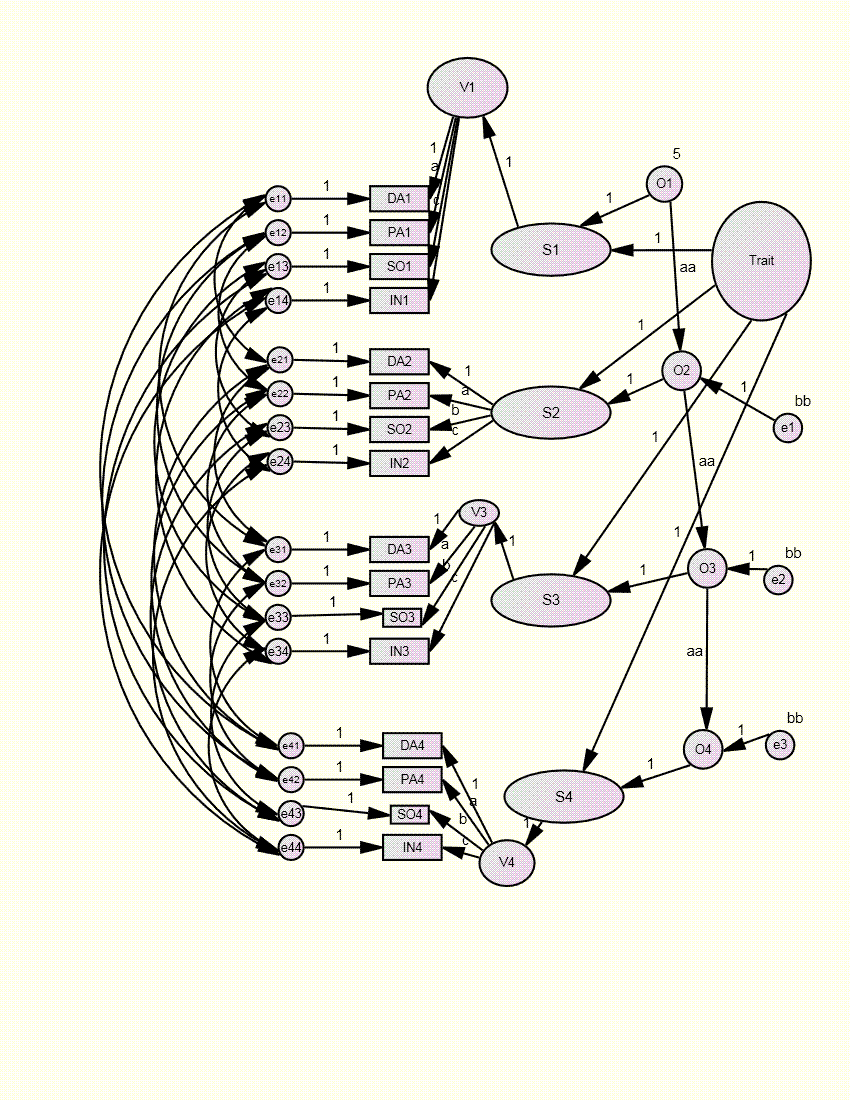
STARTS and TSO Models
STARTS (or TSE) Model – Univariate Models
See Kenny, D. A., & Zautra, A. (2001). Trait-state models for longitudinal data. In A. Sayer & L. M. Collins (Eds.), New methods for the analysis of change (pp. 243-263). Washington, DC: American Psychological Association.
ST (Trait) – Stable Trait: A latent
variable that does not change
ART
(State) – Autoregressive Trait: A latent variable that changes slowly
S
(Error) – State: A latent variable that is random

Model
stable trait (autoregressive factor
of one)
autoregressive
trait (less than one but greater than zero)
state
(zero stability)
in single indicator model, error variance contained here
Identification
at least 4 waves
autoregressive trait cannot be too stable or unstable
serious empirical under-identification issues
need many waves (10 or so)
large numbers of participants
force a complicated nonlinear
constraint
V(ARTt) = V(ARTt-1)(1
– pARTtARTt-12) + V(Ut)
how to?
use a program that does so (e.g.,
Mplus or LISREL)
or iterate
in first run, fix V(ART1)
In next run V(ART1) to
estimated V(ARTt) from the prior run
can also allow for
variances to change over time
paths from ST, ART, and S
to the measure no longer set to 1
one
wave, marker wave (e.g., wave 1)
other
waves the three paths set to the same value (e.g., w2, w3, w4)
that path squared represents how
much more variance that wave has relative to the marker wave
Example
Trouble running
Model for SO does run with unequal variance over time
Variances: ST -- 1.892; ART -- 7.202; S -- 7.336
AR
coefficient: .892
More of a
theoretical than a practical model
complicated (e.g., non-linear constraint)
estimation problems
anomalous
results
e.g., for this data set we could not obtain a solution
still can be useful (Donnellan et al. Self Esteem Study)
Multivariate Models
Multiple Indicator STARTS Model

Trait-State-Occasion (TSO) Model
Cole, Martin, & Steiger (2005) – Psychological Methods, 10, 3-20.
Ormel
& Schaufeli (1991) – JPSP, 60, 288-299.
Essentially the STARTS model with no
state factors
Trait = Stable Trait
State = Autoregressive Trait
Suggested Changes
Invariance of factor loadings
Correlated
measurement errors
Stationarity of State variance V(S1)(1
– aa2) = V(Ut)
Each model can allow for non-stationary variances
For each time create a latent
variable.
Have the latent variables (T+S for
TSO and ST, ART, S for STARTS) cause this latent variable
Fix those paths to be equal with
time; for one time set all paths to 1
Parameter measures the change in
standard deviation across time
Mplus Setup and Output for STARTS
TITLE: Mplus run
Multivariate STARTS Model for Windle Data – Females
Note nonlinear constraints
Note Stable Trait Variance is estimated to be zero
DATA: FILE is C:\MyDocuments\MyData\Windle\wincov.txt;
type is covariance;
nobservations=433;
VARIABLE: NAMES ARE da1 pa1 so1 in1 da2 pa2 so2 in2
da3 pa3 so3 in3 da4 pa4 so4 in4;
UseVAR = da1-in4;
analysis:
iterations = 1000;
model:
dep1 by Da1@1;dep1 by pa1 (b); dep1 by so1 (c); dep1 by in1 (d);
dep2 by da2@1;dep2 by pa2 (b); dep2 by so2 (c); dep2 by in2 (d);
dep3 by da3@1;dep3 by pa3 (b); dep3 by so3 (c); dep3 by in3 (d);
dep4 by da4@1;dep4 by pa4 (b); dep4 by so4 (c); dep4 by in4 (d);
STrait by DEP1@1; STrait by DEP2@1;
STrait by DEP3@1 ; STrait by DEP4@1;
State1 by DEP1@1; State2 by DEP2@1;
State3 by DEP3@1 ; State4 by DEP4@1;
dep1@0.0;dep2@0.0;dep3@0.0;dep4@0.0;
ART1 by DEP1@1; ART2 by DEP2@1 ;
ART3 by DEP3@1 ; ART4 by DEP4@1 ;
ART2 on ART1*.5 (b1); ART3 on ART2 (b1); ART4 on ART3 (b1);
ART1 ART2 ART3 ART4 with STrait@0;
STrait (stv);
state1 (ev);state2 (ev);state3 (ev);state4 (ev);
art1 (v);
art2 (vv);
art3 (vv);
art4 (vv);
State1 with State2@0; State1 with State3@0;State1 with State4@0;
State2 with State3@0; State2 with State4@0; State3 with State4@0;
ART1 ART2 ART3 ART4 with State1@0;
ART1 ART2 ART3 ART4 with State2@0;
ART1 ART2 ART3 ART4 with State3@0;
ART1 ART2 ART3 ART4 with State4@0;
state1 state2 state3 state4 with strait@0;
da1 with da2;da1 with da3;da1 with da4;da2 with da3;da2 with da4;da3 with da4;
pa1 with pa2;pa1 with pa3;pa1 with pa4;pa2 with pa3;pa2 with pa4;pa3 with pa4;
in1 with in2;in1 with in3;in1 with in4;in2 with in3;in2 with in4;in3 with in4;
so1 with so2;so1 with so3;so1 with so4;so2 with so3;so2 with so4;so3 with so4;
model constraint:
vv= v - v*b1*b1;
stv>0;
ev > 0;
vv > 0;
output: sampstat stand;
INPUT
START Model for Windle Data
SUMMARY OF ANALYSIS
Number of groups 1
Number of observations 433
Number of dependent variables 16
Number of independent variables 0
Number of continuous latent variables 13
Observed dependent variables
Continuous
DA1 PA1 SO1 IN1 DA2 PA2
SO2 IN2 DA3 PA3 SO3 IN3
DA4 PA4 SO4 IN4
Continuous latent variables
DEP1 DEP2 DEP3 DEP4 STRAIT STATE1
STATE2 STATE3 STATE4 ART1 ART2 ART3
ART4
Estimator ML
Information matrix EXPECTED
Maximum number of iterations 1000
Convergence criterion 0.500D-04
Maximum number of steepest descent iterations 20
Input data file(s)
C:\MyDocuments\MyData\Windle\wincov.txt
Input data format FREE
THE MODEL ESTIMATION TERMINATED NORMALLY
TESTS OF MODEL FIT
Chi-Square Test of Model Fit
Value 144.574
Degrees of Freedom 89
P-Value 0.0002
Chi-Square Test of Model Fit for the Baseline Model
Value 4170.345
Degrees of Freedom 120
P-Value 0.0000
CFI/TLI
CFI 0.986
TLI 0.982
Loglikelihood
H0 Value -15642.290
H1 Value -15570.003
Information Criteria
Number of Free Parameters 47
Akaike (AIC) 31378.580
Bayesian (BIC) 31569.905
Sample-Size Adjusted BIC 31420.753
(n* = (n + 2) / 24)
RMSEA (Root Mean Square Error Of Approximation)
Estimate 0.038
90 Percent C.I. 0.026 0.049
Probability RMSEA <= .05 0.964
SRMR (Standardized Root Mean Square Residual)
Value 0.071
MODEL RESULTS
Estimates S.E. Est./S.E. Std StdYX
DEP1 BY
DA1 1.000 0.000 0.000 4.795 0.955
PA1 0.410 0.016 25.483 1.968 0.625
SO1 0.616 0.021 29.346 2.955 0.718
IN1 0.174 0.008 22.547 0.837 0.551
DEP2 BY
DA2 1.000 0.000 0.000 4.795 0.966
PA2 0.410 0.016 25.483 1.968 0.645
SO2 0.616 0.021 29.346 2.955 0.727
IN2 0.174 0.008 22.547 0.837 0.588
DEP3 BY
DA3 1.000 0.000 0.000 4.795 0.953
PA3 0.410 0.016 25.483 1.968 0.652
SO3 0.616 0.021 29.346 2.955 0.738
IN3 0.174 0.008 22.547 0.837 0.563
DEP4 BY
DA4 1.000 0.000 0.000 4.795 0.954
PA4 0.410 0.016 25.483 1.968 0.648
SO4 0.616 0.021 29.346 2.955 0.746
IN4 0.174 0.008 22.547 0.837 0.610
STRAIT BY
DEP1 1.000 0.000 0.000 0.003 0.003
DEP2 1.000 0.000 0.000 0.003 0.003
DEP3 1.000 0.000 0.000 0.003 0.003
DEP4 1.000 0.000 0.000 0.003 0.003
STATE1 BY
DEP1 1.000 0.000 0.000 0.561 0.561
STATE2 BY
DEP2 1.000 0.000 0.000 0.561 0.561
STATE3 BY
DEP3 1.000 0.000 0.000 0.561 0.561
STATE4 BY
DEP4 1.000 0.000 0.000 0.561 0.561
ART1 BY
DEP1 1.000 0.000 0.000 0.828 0.828
ART2 BY
DEP2 1.000 0.000 0.000 0.828 0.828
ART3 BY
DEP3 1.000 0.000 0.000 0.828 0.828
ART4 BY
DEP4 1.000 0.000 0.000 0.828 0.828
ART2 ON
ART1 0.868 0.032 26.853 0.868 0.868
ART3 ON
ART2 0.868 0.032 26.853 0.868 0.868
ART4 ON
ART3 0.868 0.032 26.853 0.868 0.868
ART1 WITH
STRAIT 0.000 0.000 0.000 0.000 0.000
STATE1 0.000 0.000 0.000 0.000 0.000
STATE2 0.000 0.000 0.000 0.000 0.000
STATE3 0.000 0.000 0.000 0.000 0.000
STATE4 0.000 0.000 0.000 0.000 0.000
ART2 WITH
STRAIT 0.000 0.000 0.000 0.000 0.000
STATE1 0.000 0.000 0.000 0.000 0.000
STATE2 0.000 0.000 0.000 0.000 0.000
STATE3 0.000 0.000 0.000 0.000 0.000
STATE4 0.000 0.000 0.000 0.000 0.000
ART3 WITH
STRAIT 0.000 0.000 0.000 0.000 0.000
STATE1 0.000 0.000 0.000 0.000 0.000
STATE2 0.000 0.000 0.000 0.000 0.000
STATE3 0.000 0.000 0.000 0.000 0.000
STATE4 0.000 0.000 0.000 0.000 0.000
ART4 WITH
STRAIT 0.000 0.000 0.000 0.000 0.000
STATE1 0.000 0.000 0.000 0.000 0.000
STATE2 0.000 0.000 0.000 0.000 0.000
STATE3 0.000 0.000 0.000 0.000 0.000
STATE4 0.000 0.000 0.000 0.000 0.000
STATE1 WITH
STATE2 0.000 0.000 0.000 0.000 0.000
STATE3 0.000 0.000 0.000 0.000 0.000
STATE4 0.000 0.000 0.000 0.000 0.000
STRAIT 0.000 0.000 0.000 0.000 0.000
STATE2 WITH
STATE3 0.000 0.000 0.000 0.000 0.000
STATE4 0.000 0.000 0.000 0.000 0.000
STRAIT 0.000 0.000 0.000 0.000 0.000
STATE3 WITH
STATE4 0.000 0.000 0.000 0.000 0.000
STRAIT 0.000 0.000 0.000 0.000 0.000
STATE4 WITH
STRAIT 0.000 0.000 0.000 0.000 0.000
DA1 WITH
DA2 -0.813 0.522 -1.557 -0.813 -0.033
DA3 -0.349 0.527 -0.663 -0.349 -0.014
DA4 -0.563 0.510 -1.105 -0.563 -0.022
DA2 WITH
DA3 0.270 0.518 0.521 0.270 0.011
DA4 -0.187 0.497 -0.377 -0.187 -0.008
DA3 WITH
DA4 -0.550 0.516 -1.067 -0.550 -0.022
PA1 WITH
PA2 2.469 0.317 7.792 2.469 0.257
PA3 2.068 0.306 6.746 2.068 0.218
PA4 2.007 0.307 6.537 2.007 0.210
PA2 WITH
PA3 2.270 0.296 7.663 2.270 0.247
PA4 2.409 0.300 8.032 2.409 0.260
PA3 WITH
PA4 2.481 0.298 8.311 2.481 0.271
IN1 WITH
IN2 0.551 0.078 7.109 0.551 0.255
IN3 0.510 0.082 6.253 0.510 0.226
IN4 0.275 0.070 3.903 0.275 0.132
IN2 WITH
IN3 0.430 0.074 5.827 0.430 0.203
IN4 0.418 0.066 6.324 0.418 0.214
IN3 WITH
IN4 0.418 0.070 5.939 0.418 0.205
SO1 WITH
SO2 3.045 0.463 6.581 3.045 0.182
SO3 3.243 0.456 7.117 3.243 0.197
SO4 3.063 0.442 6.929 3.063 0.188
SO2 WITH
SO3 2.745 0.438 6.261 2.745 0.169
SO4 2.758 0.428 6.437 2.758 0.171
SO3 WITH
SO4 3.086 0.428 7.211 3.086 0.195
Variances
STRAIT 0.000 0.063 0.003 1.000 1.000
STATE1 7.227 0.844 8.561 1.000 1.000
STATE2 7.227 0.844 8.561 1.000 1.000
STATE3 7.227 0.844 8.561 1.000 1.000
STATE4 7.227 0.844 8.561 1.000 1.000
ART1 15.763 1.319 11.954 1.000 1.000
Residual Variances
DA1 2.194 0.787 2.787 2.194 0.087
PA1 6.051 0.439 13.785 6.051 0.610
SO1 8.202 0.640 12.811 8.202 0.484
IN1 1.606 0.113 14.160 1.606 0.697
DA2 1.631 0.717 2.275 1.631 0.066
PA2 5.430 0.394 13.788 5.430 0.584
SO2 7.784 0.601 12.946 7.784 0.471
IN2 1.322 0.094 14.106 1.322 0.654
DA3 2.316 0.749 3.094 2.316 0.092
PA3 5.228 0.384 13.625 5.228 0.574
SO3 7.291 0.578 12.611 7.291 0.455
IN3 1.512 0.107 14.128 1.512 0.684
DA4 2.254 0.726 3.103 2.254 0.089
PA4 5.338 0.390 13.703 5.338 0.580
SO4 6.976 0.555 12.571 6.976 0.444
IN4 1.182 0.085 13.943 1.182 0.628
DEP1 0.000 0.000 0.000 0.000 0.000
DEP2 0.000 0.000 0.000 0.000 0.000
DEP3 0.000 0.000 0.000 0.000 0.000
DEP4 0.000 0.000 0.000 0.000 0.000
ART2 3.881 0.980 3.960 0.246 0.246
ART3 3.881 0.980 3.960 0.246 0.246
ART4 3.881 0.980 3.960 0.246 0.246
R-SQUARE
Observed
Variable R-Square
DA1 0.913
PA1 0.390
SO1 0.516
IN1 0.303
DA2 0.934
PA2 0.416
SO2 0.529
IN2 0.346
DA3 0.908
PA3 0.426
SO3 0.545
IN3 0.316
DA4 0.911
PA4 0.420
SO4 0.556
IN4 0.372
Latent
Variable R-Square
DEP1 1.000
DEP2 1.000
DEP3 1.000
DEP4 1.000
ART2 0.754
ART3 0.754
ART4 0.754