David A. Kenny
August 29, 2011
Structural Models with Latent Variables
Go to:
Introduction
Measurement Model
Structural Model
Example
Problems with the Wald Test
Williams and Hazer Approach to Measurement Error
Standardization
Missing Data
Introduction
Causal models with latent variables represent a mix of path analysis and confirmatory factor analysis which have been called a hybrid model. In essence, the measurement model is first estimated and the correlations or covariance matrix between constructs or factors then serves as input to estimate the structural coefficients between constructs or latent variables. In actuality, both models are simultaneously estimated by a structural equation modeling program such as AMOS, LISREL, or EQS.
Measurement Model
- definition
- the mapping of measures onto theoretical constructs
- constituent parts
- loadings of the measures on the theoretical constructs
- error variances
- error covariances (correlated errors)
- test of specification error:
- Estimate a structural model that is just-identified or estimate a confirmatory factor analysis model (no causation, just correlations between the latent variables)
- Before the structural model is interpreted, it must first be established that the measurement model fits.
Structural Model
· definition
o the causal and correlational links between theoretical variables
- constituent parts
- paths
- variances of the exogenous variables
- covariances between exogenous variables
- variances of the disturbances of endogenous variables
- covariances between disturbances
- covariances between disturbances and exogenous variables (usually set to zero)
- test of specification error
- compare the specified structural model to a model in which the structural model is just-identified
Example (go to Respecification webpage for more details)
Ajzen & Madden (Ajzen, I., & Madden, T. J. (1986). Prediction of goal-directed 'font-size:13.5pt;font-family:"Arial","sans-serif"'>
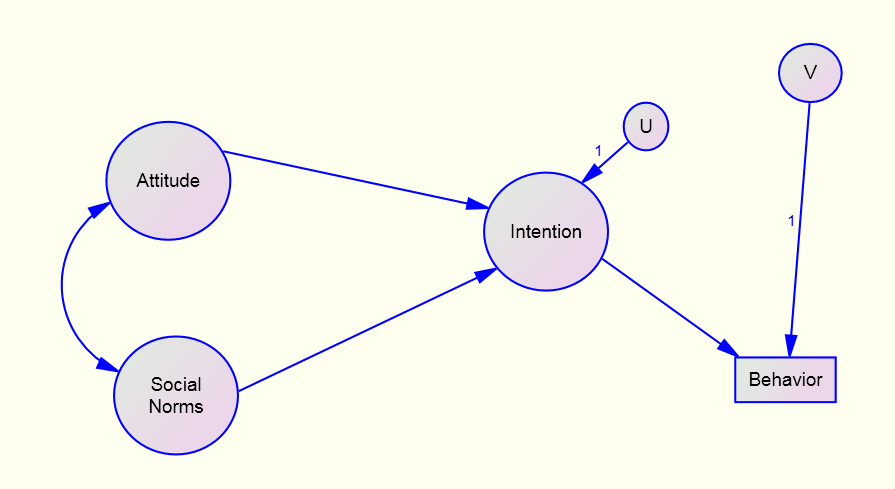
Model
Measurement Model
Two indicators of Intention, Attitude, and Social Norms
One indicator of Behavior which is assumed to have no measurement error.
Structural Equations
Intention = Attitude + Social Norms +U
Behavior = Intention + V
Parameters
Measurement Model
3 loadings (one for Intention, Attitude and Norms)
6 error variances
4 variances of factors
6 covariances between factors (Behavior is considered a factor)
Structural Model
3 paths
1 covariance between exogenous
2 exogenous variances
2 disturbance variances
Degrees of Freedom
Measurement Model
knowns: (8)(7)/2 = 28
unknowns (parameters): 19
df: 9
Structural Model
knowns: (5)(4)/2 = 10
There are just 4 “variables” in the structural model.
unknowns: 8
df: 2
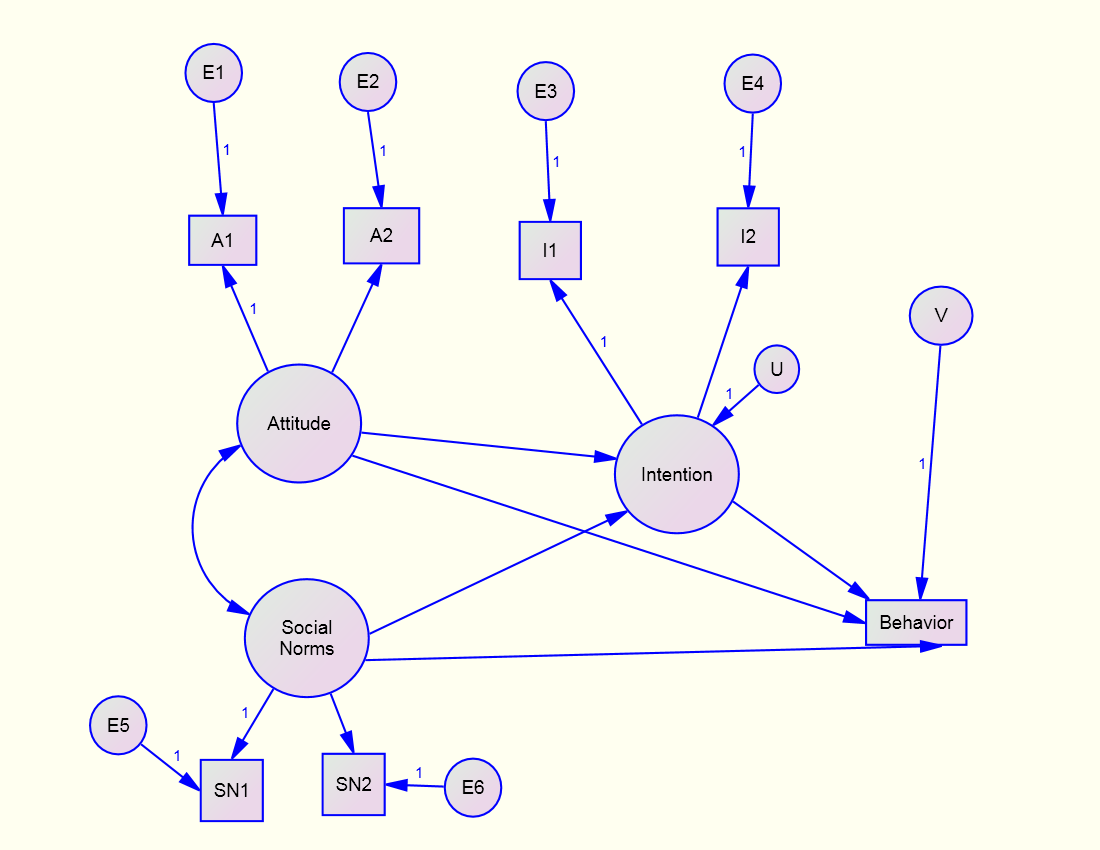
Total Model
df: 2 + 9 = 11
Pure Structural Model
CFA Model
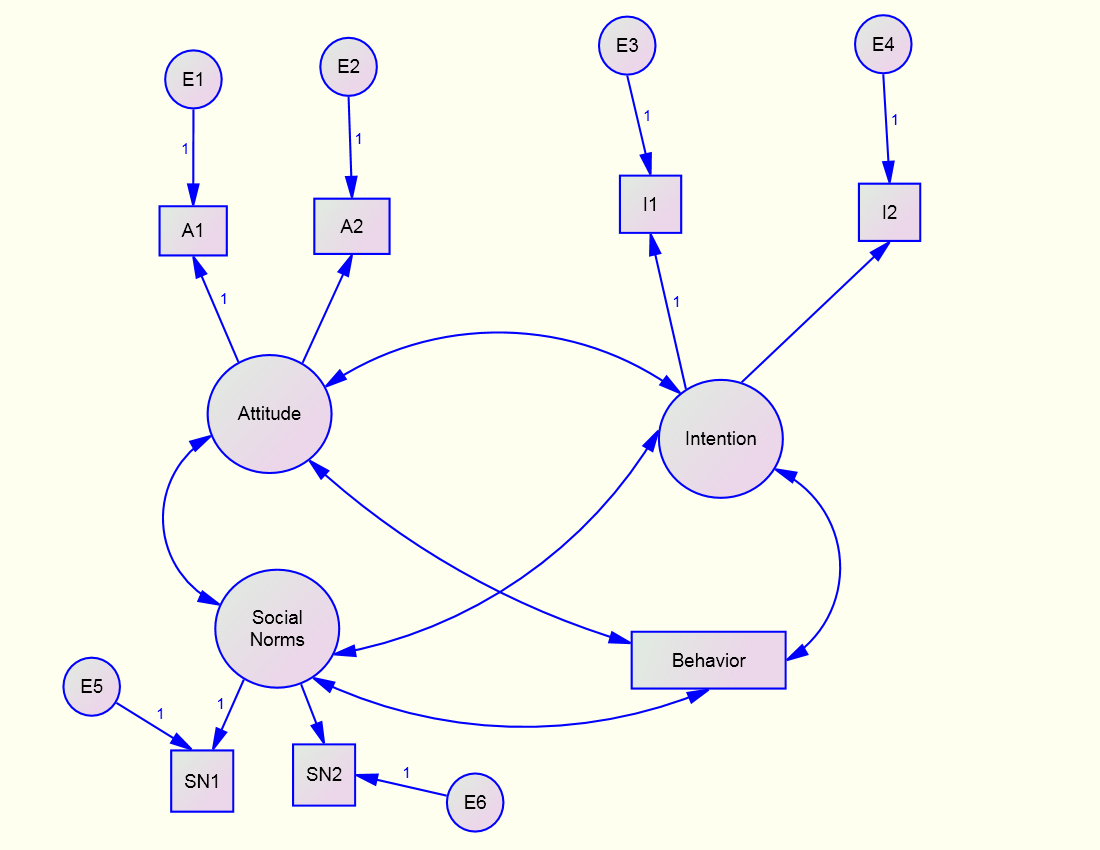
Just-Identified Structural Model
Test
the Measurement Model: CFA (or equivalently a Just-identified Structural Model)
Note that to make the structural model just-identified paths must be drawn from Attitude and Social Norms to Behavior
Fit of both models: χ²(11) = 16.09, p = .065
The Ajzen & Madden model has decent fit
Test the Structural Model
Specified Paths
path estimate CR p χ² diff p
SN → I: -0.033 -0.144 .885 0.019 .892
A → I: 0.973 4.116 <.001 16.111 <001
I → B: 0.415 4.653 <.001 23.999 <.001
Problems with Testing of Parameters Using the Wald Test
The Problem (see the Gonzalez & Griffin, Psychological Methods, 2001)
Markers A →I (CR)
A1, I1 4.116
A2, I1 4.028
A1, I2 3.736
A2, I2 3.670
Result: Critical ratios depend on the choice of the marker. If you change the marker variable, some things change in the model and some things say the same.
What stays the same:
Chi square and the df.
All standard fit indices.
Standardized loadings and paths.
Standardized
residuals.
R squared.
What changes:
Unstandardized
loadings and paths.
Critical ratios (Wald tests).
Modification indices..
Solution: Use chi-square difference test if the test is important as it does not depend on the choice of marker.
For the above example it is χ²(1) = 16.111 making the “CR” (the square root of chi square) equal to 4.014.
Williams and Hazer Option to Measurement Error
Overview
A variant of correction for attenuation
Single indicator, not multiple indicators
Must know the reliability of each measure
How
Structural Model: latent variables
Each latent variable causes its measure (path fixed to one)
Each measure has an error path (path fixed to one)
Error variance fixed to
Variance of the measure times one minus the reliability
Of for standardized data, one minus the reliability
Need to test paths using chi square difference test as CR appear to be too conservative.
Advantages
Fewer variables
Usually smaller standard errors for the paths
Easier to estimate
No Heywood cases
Fewer convergence issues
Disadvantages
No test of the measurement model
Assumes the measurement model is correct
Not so traditional and so may meet editorial objections
Standardization
Standardization can occur at many places within the modeling process.
the raw data
the data matrix
the model specification
the transformed model
If the model is not standardized, tests refer to the model not the standardized solution. There are estimation methods based on the assumption that the correlation matrix has been entered (RAMONA), but is rarely used. This procedure does allow the standardization of latent endogenous variables.
When to Standardize
when the units of measurement not very interpretable
desire to compare coefficients with different units of measurement
more experience with betas than b coefficients
When Not to Standardize
units of measurement are meaningful
paths are usually set equal (so in multiple groups analysis one should analyze the covariance matrix) or paths absolute values compared (e.g., dyadic analysis)
Missing
Data (being revised)
Rubin and Little
typology:
1. The data are missing at random (MCAR).
2. Data missing due a variable in the data set which is not missing (MAR).
3. Data missing due to a variable that is missing or unmeasured (NMAR).
Strategies for handing for missing data – given MAR and MCAR
Data Deletion
Pairwise Deletion – can be problematic
Listwise Deletion
May result in the loss of too many cases
Sample biased: means, variances, & covariances
Imputation – Substitute a Value
Traditionally the mean
Alternatives
Regression
Maximum Likelihood
Multiple Imputation (not used often in SEM)
Full Information Maximum Likelihood (FIML)
By far the most common approach to missing data in SEM
Creates Multiple Groups
Do not get the following output in Amos
Variance-Covariance Matrix of the Measures
Modification Indices
Standardized Residuals
Some Measures of Fit
How to handle an auxiliary variables, i.e., variables in the dataset but not in the model.
Could be important with MAR.