David A. Kenny
June 12, 2016
This mediation macro called MedTextR, was writted by David A. Kenny. The original version was completed on January 8, 2013 and this revised version was completed March 28, 2014. The early version had a problem with the figures. It is a very preliminary version, and it is to be used for testing and developent purposes, not analysis. The program will be updated and so it is advisable to check back for updates. The SPSS version was used the starting point, but several different modifications were made: robust estimation, easier input, and clearer figures, both standardized and unstandardized.
Thank You!
I thank Ken Kelley, Alexander Demos, and Craig Waterman who gave my very helpful advice. Also, I thank my good friend the late Bob Calsyn for the sample data. I thank Petr Janata who found a bug in the program. I am very open to suggestions and advice from users of this program, as well as rewrites of the code. One reason for writing it in R is because it is opensource. I am a very amateur R programmer, and I am very open to suggestions or revisions of the program. The program is limited to a single X, Y, and M variable and up to 10 covariates.
Downloads:
MedTextR.txt (the R program)
MTRfigure.tif
Macro Output (figures and text placed in a pdf file)
Package "ReadImages" (Need these files for the ReadImages packages no longer available on R)
MedTextv2.R (an adapation of the program written by Petr Janata that runs without the GUI)
Make sure to place MTRfigure.tif (the template for the mediation figures) in the directory where you want the output. Then open MedTextR in R. The following packages need to be downloaded from R: foreign, boot, gdata, rtiff, and MASS. Also the package ReadImages is no longer available on R but you can download it at the above address or at "https://cran.r-project.org/src/contrib/Archive/ReadImages/".
The macro may take a few minutes to run and so please be patient. Note that the output (the text file) cannot be viewed in R. It needs to be opened using NotePad or Word. R does give you informaton on the progress of the program and warings. For the example, you should see:
MedTextR has begun.
Bootstrap resampling has begun. This process takes a considerable amount of time. Please be patient.
WARNINGS:
1. There is one outlier (studentized residual greater than 3.5) for the variable Housing Contacts. Examine the output to see what observations are considered to be outliers.
2. There is evidence that the effect of Housing Contacts on Stable Housing is nonlinear and either a data transformation or a nonlinear term might be advisable.
Run is now finished and the following files can now be viewed:
The text file that describes and tables the mediation results: C:/MedTextR.txt
The two mediation figures: C:/MTFig1.png (unstandardized) C:/MTFig1.png (standardized)
The R output of the results: C:/rfile.txt.
Again this is a very preliminary, Beta version of this program. Expect bugs and crashes.
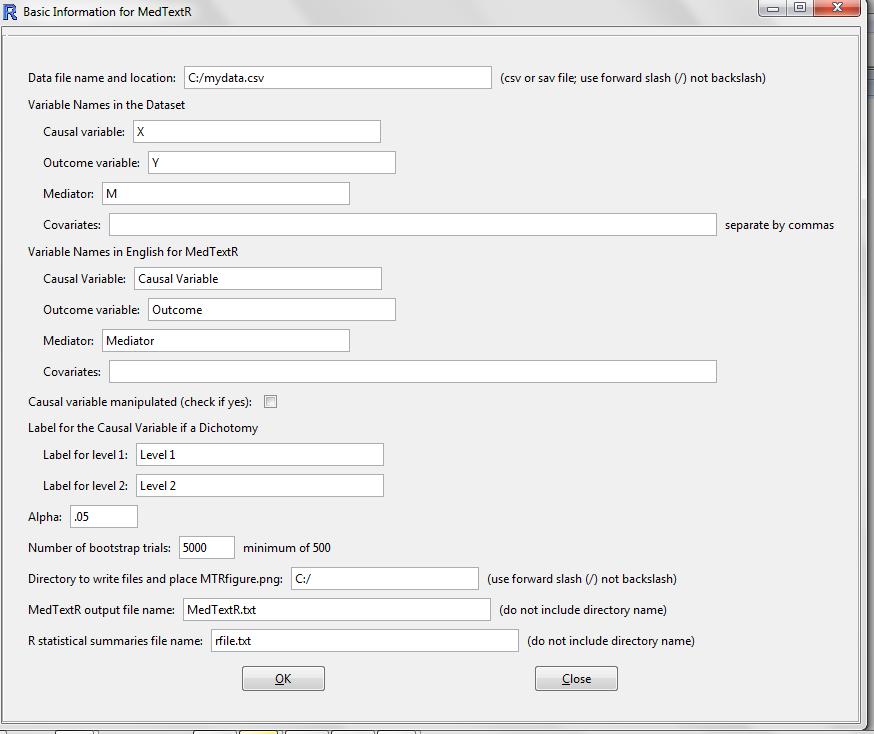
When the program is opened you are shown the opening screen:

Make the necessary changes in the above for your application.
MedText.R currently provides 20 different warnings:
1. The outcome variable is dichotomous and logistic regression, not multiple regression, should be used. The output from MedText in this case is wrong! 2. The mediator is dichotomous and logistic regression, not multiple regression, should be used. The output from MedText in this case is wrong! 3. Given the large sample size, you might want to consider lowering alpha from .05 to a smaller value. 4. The small sample size might preclude a mediational analysis.
5. As zero does not appear to be meaningful value for causal variable, you might consider grand mean centering the causal variable.
6. As zero does not appear to be meaningful value for mediator, you might consider grand mean centering the mediator.
7. There are outliers for the mediator variable. Examine the output to see what cases are considered to be outliers (studentized residual greater than 3.5).
8. There are outliers for the mediator variable. Examine the output to see what cases are considered to be outliers (studentized residual greater than 3.5).
9. There is evidence that the effect of the mediator or the causal variable on the outcome variable is nonlinear and either a data transformation or a nonlinear term might be advisable. 10. There is evidence that the effect of the causal variable on the mediator variable is nonlinear and either a data transformation or a nonlinear term might be advisable. 11. There is severe multicollinearity between the causal and mediator variables which may compromise the Step 3 and 4 tests. 12. There is severe multicollinearity of between the causal variable and the covariates which may compromise the Step 1 and 4 tests. 13. There is severe multicollinearity between mediator and the covariates which may compromise the Step 3. 14. The results using robust regression lead to different conclusions than that using ordinary least squares. 15. The causal and mediator variables explain less than 1 percent of the variance of outcome variable. 16. The causal explains less than 1 percent of the variance of mediator. 17. There are sufficient missing data so as to make the use of listwise missing data option less than optimal. Better strategies for missing data (e.g., multiple imputation or full information maximum likelihood). 18. The causal variable and mediator interact to explain the outcome variable and needs to be added to the model. 19. No "values" were given causal variable which is a dichotomy, and so "One" and "Two" have been assigned. 20. It is recommended that there be a minimum of 5,000 bootstrap trials for reliable confidence intervals.